Dashboard
Displays audit metrics and status.
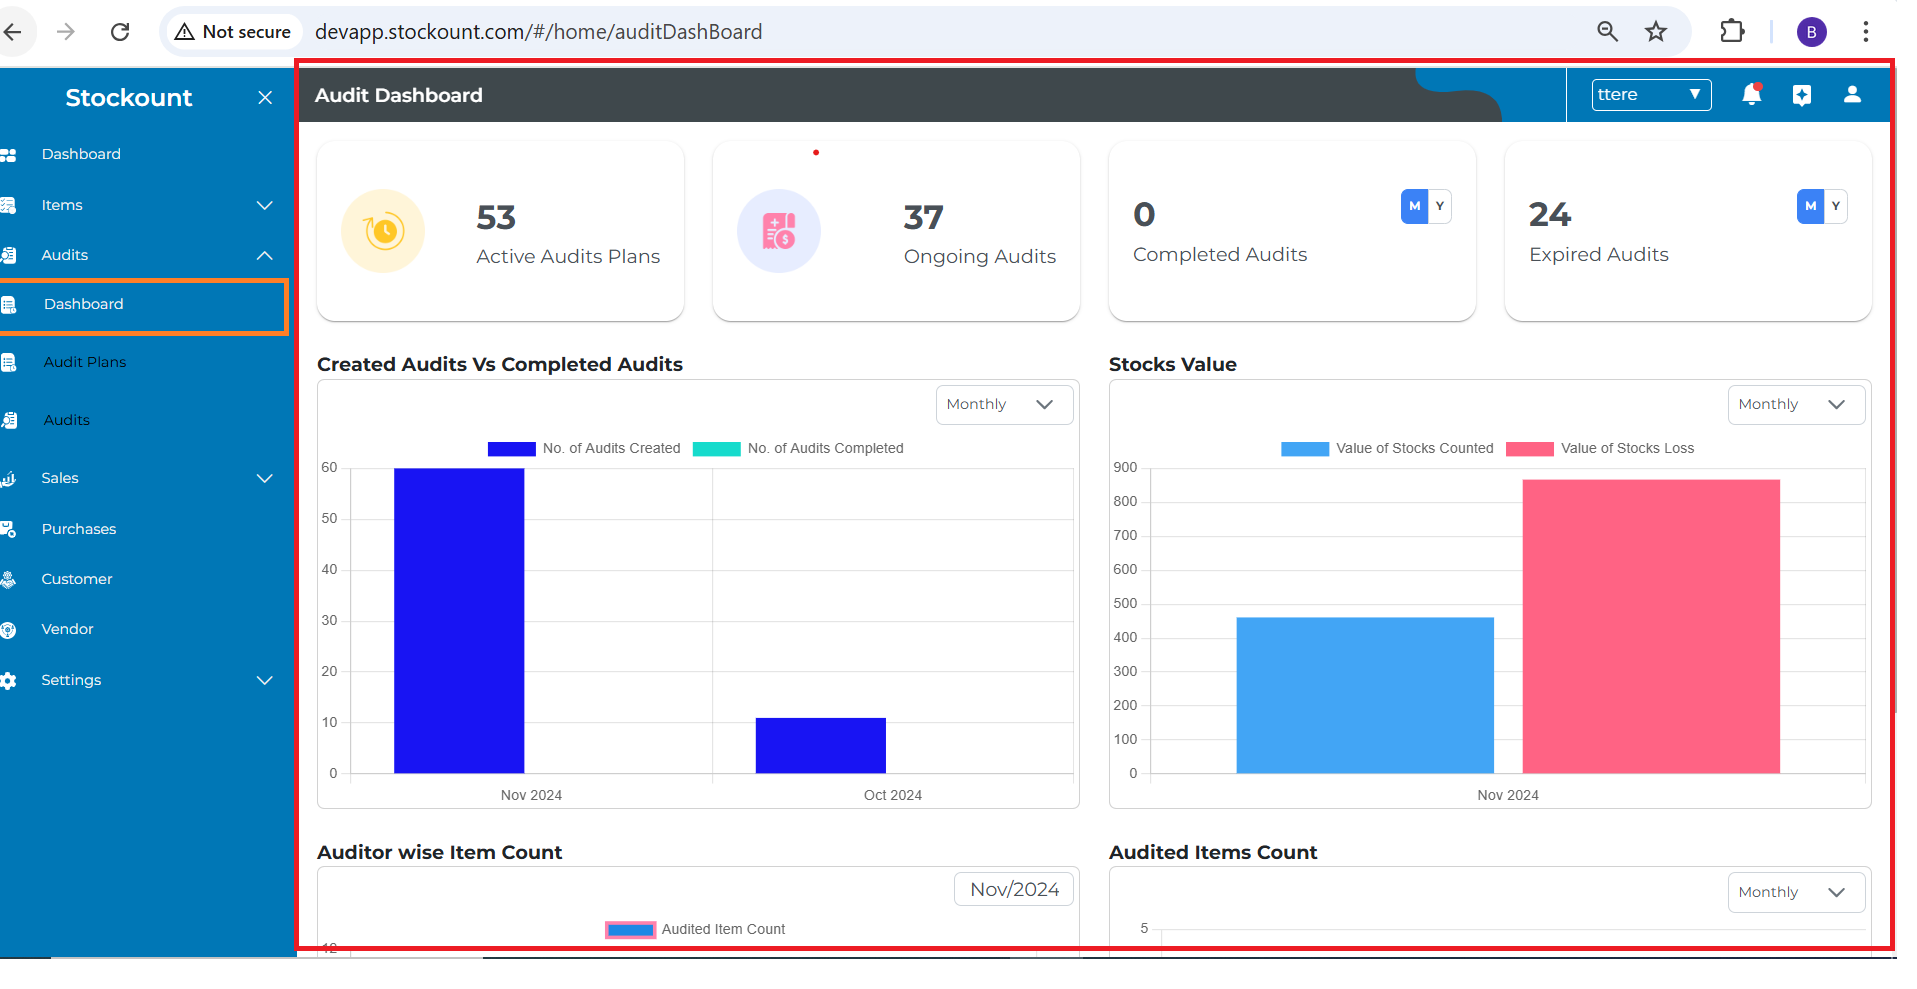
Audit Dashboard Metrics and Charts
The dashboard displays key audit metrics and charts that help users track the status and progress of audits.
Key Metrics (Top Section)
- Active Audit Plans: Count of currently active audit plans.
- Ongoing Audits: Number of audits currently in progress.
- Completed Audits: Count of audits that have been completed.
- Expired Audits: Number of audits that exceeded their scheduled timeframe without completion.
Charts
- Created Audits vs Completed Audits: A bar chart displaying the number of audits created and completed over time (viewable by Month, Week, or Day).
- Stocks Value: A bar chart comparing the value of counted stocks versus stocks lost, segmented by frequency (Monthly, Weekly, Daily).
- Auditor-wise Item Count: A line chart showing the count of items audited by each auditor.
- Audited Items Count: A bar chart showing the frequency of specific items audited.